It's no secret you can import data from a SharePoint list into Microsoft's Power BI. However, it is also possible to easily bring Power BI data into SharePoint.
SharePoint, the document management and collaboration platform from Microsoft, now enables users to incorporate analytics directly into the platform as well as view them from SharePoint. Embedding analytics directly within SharePoint can eliminate some of the hurdles to data-driven decision making, where users previously had to have various applications open to see the data. Now the data can exist natively in a content management app. There are a few different methods for doing so.
Method 1: Importing raw data
The first way to make Power BI data available in SharePoint is by exporting the raw data. When you mouse over a Power BI visualization, an icon appears that looks like three periods in the upper-right-hand corner of that visualization. Click on this icon, followed by the Export Data icon, shown in Figure 1. The report data can be saved as a comma-separated values file. Now, simply upload the CSV file to a SharePoint list within your team site.
Figure 1: Click on the Export Data icon.
Method 2: Using a URL
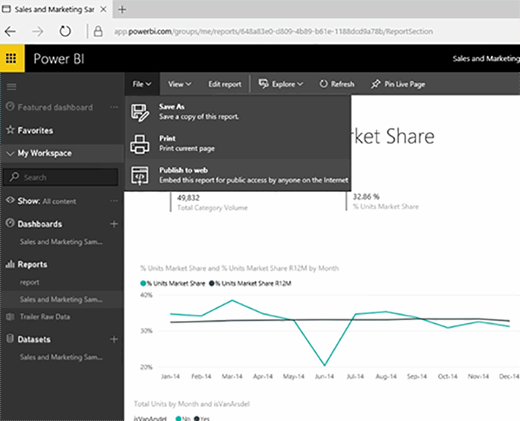
A second method involves using a URL. Begin the process by clicking a visualization within the Power BI interface. Next, choose the Publish to Web option from the File menu, shown in Figure 2. Once you do this, you will see a message telling you that you can get a link or embed code that you can include on a website or send in an email. Click on the Create Embed Code button, followed by the Publish button to get this code.
Figure 2: Choose the Publish to Web option from the File menu.
Now, open your team site and navigate to the page on which you want to insert the Power BI dashboard. Click the Edit link to begin editing the page, and then go to the Insert tab and click on the Embed Code icon, shown in Figure 3.
Figure 3: Go to the Insert tab and click on the Embed Code icon.
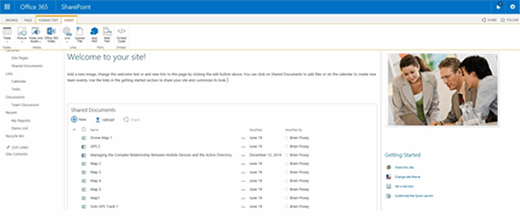
At this point, you can paste your embedded code into the space provided, click on the Insert button, followed by the Save button. The Power BI dashboard will now be added to the SharePoint site, as shown in Figure 4.
Figure 4: The Power BI dashboard has been added to SharePoint.
Method 3: Analyzing the data in Excel
Embedding analytics directly within SharePoint can eliminate some of the hurdles to data-driven decision making.
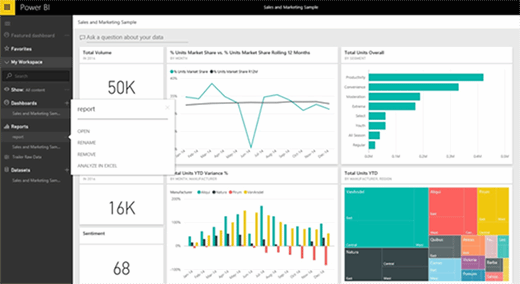
Begin the process by logging into Power BI and clicking on the visualization that you want to share. When you do, Power BI will display a larger view of the dashboard. Now, click on the Power BI File menu and then choose the Save As option. When prompted, name the report. Then you can save the report into Power BI's Reports container. Now, right-click on the report and choose the Analyze in Excel option, as shown in Figure 5.
Figure 5: Right click on the report and choose the option to analyze the report in Excel.
At this point, a pop-up window may appear that contains a message indicating that new versions of the Excel libraries are available. You will need to download this update before you will be able to analyze Power BI data in Excel. The download exists in the form of an MSI file, which makes it easy to push the add-in to anyone else whose copy of Excel 2016 may need to be updated.
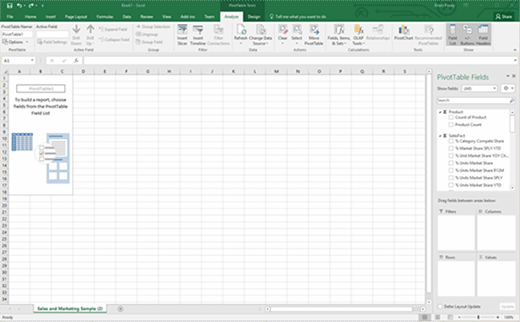
When you open the report in Excel, you won't see the Power BI dashboards. Instead, you will see a message like the one shown in Figure 6, explaining that you need to choose fields from the pivot table in order to build the report. You can easily use these fields to display the data in any way that you want.
Figure 6: You will need to choose fields from the pivot table to create a report.
When you have finished formatting the spreadsheet, save it to a local file and upload it to a SharePoint list or to a document library.
As you can see, it is relatively easy to make Power BI data available through a SharePoint team site. You can embed the Power BI dashboard directly into the site, or you can make raw data available in the form of an Excel file or a CSV file.